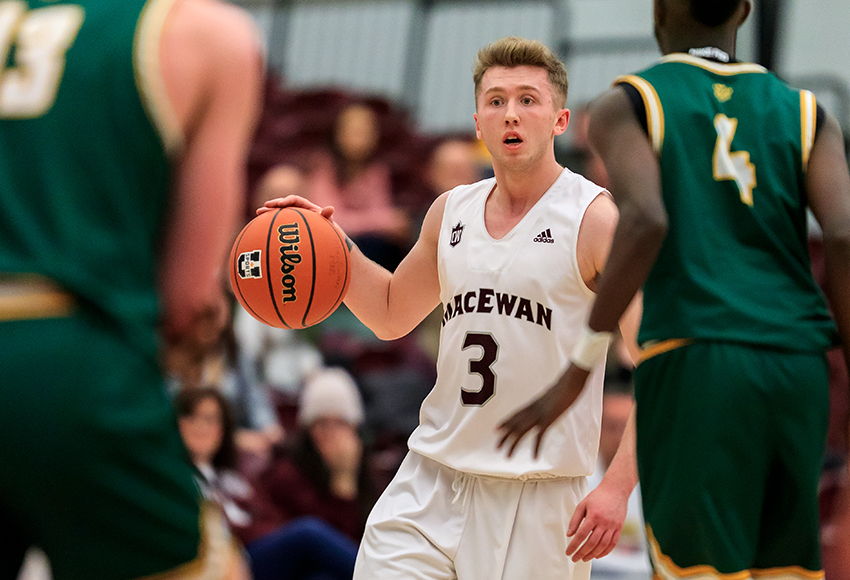
Jesse Trussler
3 Jesse Trussler

-
- Height:
- 6-1
-
- Hometown:
- Regina
-
- Position:
- Point Guard
-
- Year:
- 3
-
- High School:
- Campbell Collegiate
-
- Major:
- Arts
-
- gp
- 16
-
- pts/g
- 6.7
-
- fg %
- 30.1
-
- 3pt %
- 29.8
-
- ft %
- 71.8
-
- reb/g
- 2.8
-
- a/g
- 1.9
Bio
Trophy Case: Named Griffins' Most Improved Player in 2019-20 ... Co-winner of men's basketball leadership award in 2020-21.
Record Book: His 77.8 free throw percentage in 2019-20 is tied for the eighth-best by a Griffin in a Canada West season.
Notable: Previously played for Team Saskatchewan for four years from the U15 to U17 levels and made the all-star team ... Played for the William Penn University Statesmen ... Led Campbell Tartans to Saskatchewan 5A provincial title in 2017 ... High school teammate of Griffins wing Luke Harold ... Qualified for high school provincials in the 100 metre hurdles ... Stepdad previously played basketball for the University of Regina ... Self-proclaimed shoe fanatic.
 Robert Antoniuk photo
Player statistics
| Overall | Conference | |
|---|---|---|
| Games | 16 | 16 |
| Games started | 11 | 11 |
| Minutes | 410 | 410 |
| Minutes per game | 25.6 | 25.6 |
| FG | 31-103 | 31-103 |
| FG Pct | 30.1 | 30.1 |
| 3PT | 17-57 | 17-57 |
| 3PT Pct | 29.8 | 29.8 |
| FT | 28-39 | 28-39 |
| FT Pct | 71.8 | 71.8 |
| Off rebounds | 7 | 7 |
| Def rebounds | 37 | 37 |
| Total rebounds | 44 | 44 |
| Rebounds per game | 2.8 | 2.8 |
| Personal fouls | 28 | 28 |
| Disqualifications | 1 | 1 |
| Assists | 31 | 31 |
| Turnovers | 25 | 25 |
| Assist to turnover ratio | 1.2 | 1.2 |
| Steals | 9 | 9 |
| Blocks | 0 | 0 |
| Points | 107 | 107 |
| Points per game | 6.7 | 6.7 |
| Points per 40 min | 10.4 | 10.4 |
Game Log - Shooting
| Date | Opponent | Score | gs | min | fg | pct | 3pt | pct | ft | pct | pts |
|---|---|---|---|---|---|---|---|---|---|---|---|
| Oct 8 | UBC Okanagan | L, 77-64 | - | - | - | - | - | - | - | - | - |
| Oct 9 | UNBC | W, 83-78 | 1 | 33 | 2-8 | 25.0 | 0-5 | 0.0 | 3-7 | 42.9 | 7 |
| Oct 15 | Winnipeg | L, 78-68 | 1 | 34 | 5-12 | 41.7 | 2-6 | 33.3 | 1-2 | 50.0 | 13 |
| Oct 16 | UBC | L, 91-65 | 1 | 32 | 4-12 | 33.3 | 1-4 | 25.0 | 3-4 | 75.0 | 12 |
| Oct 22 | Saskatchewan | L, 86-62 | 1 | 36 | 5-9 | 55.6 | 1-4 | 25.0 | 7-7 | 100.0 | 18 |
| Oct 23 | Regina | L, 89-72 | 1 | 34 | 2-9 | 22.2 | 2-7 | 28.6 | 2-2 | 100.0 | 8 |
| Oct 29 | at Mount Royal University | L, 93-64 | 1 | 28 | 2-9 | 22.2 | 1-6 | 16.7 | 1-2 | 50.0 | 6 |
| Oct 30 | at Mount Royal University | L, 85-68 | 1 | 18 | 2-5 | 40.0 | 1-4 | 25.0 | 0-0 | - | 5 |
| Nov 12 | Calgary | L, 78-42 | 1 | 28 | 0-6 | 0.0 | 0-3 | 0.0 | 2-2 | 100.0 | 2 |
| Nov 13 | Calgary | L, 83-62 | 1 | 28 | 3-9 | 33.3 | 3-6 | 50.0 | 2-3 | 66.7 | 11 |
| Dec 3 | at Lethbridge | L, 106-64 | 1 | 34 | 1-10 | 10.0 | 0-4 | 0.0 | 5-5 | 100.0 | 7 |
| Dec 4 | at Lethbridge | L, 87-50 | 1 | 26 | 1-6 | 16.7 | 1-3 | 33.3 | 0-0 | - | 3 |
| Jan 14 | Alberta | L, 105-61 | - | 21 | 1-7 | 14.3 | 0-3 | 0.0 | 0-0 | - | 2 |
| Jan 15 | Alberta | L, 96-69 | - | 21 | 2-3 | 66.7 | 1-2 | 50.0 | 1-2 | 50.0 | 6 |
| Jan 28 | at Calgary | L, 95-75 | 0 | 18 | 0-3 | 0.0 | 0-2 | 0.0 | 2-2 | 100.0 | 2 |
| Jan 29 | at Calgary | L, 90-64 | 0 | 11 | 0-2 | 0.0 | 0-2 | 0.0 | 3-3 | 100.0 | 3 |
| Feb 4 | Lethbridge | - | - | - | - | - | - | - | - | - | |
| Feb 5 | Lethbridge | - | - | - | - | - | - | - | - | - | |
| Feb 11 | at Alberta | L, 108-68 | - | 30 | 2-5 | 40.0 | 0-2 | 0.0 | 1-3 | 33.3 | 5 |
| Feb 12 | at Alberta | L, 92-56 | 1 | 40 | 4-9 | 44.4 | 3-5 | 60.0 | 6-8 | 75.0 | 17 |
| Feb 18 | Mount Royal University | L, 102-62 | 1 | 29 | 3-6 | 50.0 | 2-4 | 50.0 | 2-3 | 66.7 | 10 |
| Feb 19 | Mount Royal University | L, 89-69 | 1 | 25 | 2-8 | 25.0 | 2-4 | 50.0 | 0-0 | - | 6 |
| Feb 24 | Lethbridge | L, 84-70 | 1 | 27 | 3-6 | 50.0 | 1-2 | 50.0 | 2-5 | 40.0 | 9 |
| Feb 25 | Lethbridge | L, 95-73 | 1 | 26 | 5-9 | 55.6 | 2-5 | 40.0 | 1-1 | 100.0 | 13 |
Game Log - Ball control
| Date | Opponent | Score | gs | min | off | def | reb | ast | to | stl | blk |
|---|---|---|---|---|---|---|---|---|---|---|---|
| Oct 8 | UBC Okanagan | L, 77-64 | - | - | - | - | - | - | - | - | - |
| Oct 9 | UNBC | W, 83-78 | 1 | 33 | 1 | 5 | 6 | 3 | 3 | 2 | 0 |
| Oct 15 | Winnipeg | L, 78-68 | 1 | 34 | 0 | 2 | 2 | 2 | 1 | 1 | 0 |
| Oct 16 | UBC | L, 91-65 | 1 | 32 | 1 | 2 | 3 | 3 | 2 | 0 | 1 |
| Oct 22 | Saskatchewan | L, 86-62 | 1 | 36 | 0 | 6 | 6 | 0 | 1 | 0 | 0 |
| Oct 23 | Regina | L, 89-72 | 1 | 34 | 0 | 5 | 5 | 7 | 2 | 0 | 0 |
| Oct 29 | at Mount Royal University | L, 93-64 | 1 | 28 | 0 | 2 | 2 | 2 | 2 | 1 | 0 |
| Oct 30 | at Mount Royal University | L, 85-68 | 1 | 18 | 0 | 1 | 1 | 1 | 3 | 0 | 0 |
| Nov 12 | Calgary | L, 78-42 | 1 | 28 | 2 | 1 | 3 | 0 | 2 | 0 | 0 |
| Nov 13 | Calgary | L, 83-62 | 1 | 28 | 0 | 4 | 4 | 1 | 3 | 0 | 0 |
| Dec 3 | at Lethbridge | L, 106-64 | 1 | 34 | 2 | 0 | 2 | 1 | 3 | 1 | 0 |
| Dec 4 | at Lethbridge | L, 87-50 | 1 | 26 | 0 | 1 | 1 | 2 | 0 | 2 | 0 |
| Jan 14 | Alberta | L, 105-61 | - | 21 | 0 | 2 | 2 | 3 | 2 | 0 | 0 |
| Jan 15 | Alberta | L, 96-69 | - | 21 | 0 | 4 | 4 | 4 | 0 | 1 | 0 |
| Jan 28 | at Calgary | L, 95-75 | 0 | 18 | 0 | 0 | 0 | 1 | 1 | 1 | 0 |
| Jan 29 | at Calgary | L, 90-64 | 0 | 11 | 1 | 0 | 1 | 1 | 0 | 0 | 0 |
| Feb 4 | Lethbridge | - | - | - | - | - | - | - | - | - | |
| Feb 5 | Lethbridge | - | - | - | - | - | - | - | - | - | |
| Feb 11 | at Alberta | L, 108-68 | - | 30 | 0 | 3 | 3 | 2 | 1 | 0 | 0 |
| Feb 12 | at Alberta | L, 92-56 | 1 | 40 | 0 | 3 | 3 | 3 | 3 | 1 | 0 |
| Feb 18 | Mount Royal University | L, 102-62 | 1 | 29 | 1 | 3 | 4 | 3 | 1 | 0 | 0 |
| Feb 19 | Mount Royal University | L, 89-69 | 1 | 25 | 0 | 5 | 5 | 3 | 1 | 0 | 0 |
| Feb 24 | Lethbridge | L, 84-70 | 1 | 27 | 1 | 2 | 3 | 2 | 0 | 2 | 0 |
| Feb 25 | Lethbridge | L, 95-73 | 1 | 26 | 0 | 6 | 6 | 2 | 3 | 0 | 0 |
Game Log - Ball control extended
| Date | Opponent | Score | gs | pf | dq | a/to |
|---|---|---|---|---|---|---|
| Oct 8 | UBC Okanagan | L, 77-64 | - | - | - | - |
| Oct 9 | UNBC | W, 83-78 | 1 | 0 | 0 | 1.0 |
| Oct 15 | Winnipeg | L, 78-68 | 1 | 3 | 0 | 2.0 |
| Oct 16 | UBC | L, 91-65 | 1 | 2 | 0 | 1.5 |
| Oct 22 | Saskatchewan | L, 86-62 | 1 | 3 | 0 | 0.0 |
| Oct 23 | Regina | L, 89-72 | 1 | 2 | 0 | 3.5 |
| Oct 29 | at Mount Royal University | L, 93-64 | 1 | 5 | 1 | 1.0 |
| Oct 30 | at Mount Royal University | L, 85-68 | 1 | 2 | 0 | 0.3 |
| Nov 12 | Calgary | L, 78-42 | 1 | 3 | 0 | 0.0 |
| Nov 13 | Calgary | L, 83-62 | 1 | 1 | 0 | 0.3 |
| Dec 3 | at Lethbridge | L, 106-64 | 1 | 3 | 0 | 0.3 |
| Dec 4 | at Lethbridge | L, 87-50 | 1 | 0 | 0 | - |
| Jan 14 | Alberta | L, 105-61 | - | 2 | 0 | 1.5 |
| Jan 15 | Alberta | L, 96-69 | - | 0 | 0 | - |
| Jan 28 | at Calgary | L, 95-75 | 0 | 1 | 0 | 1.0 |
| Jan 29 | at Calgary | L, 90-64 | 0 | 2 | 0 | - |
| Feb 4 | Lethbridge | - | - | - | - | |
| Feb 5 | Lethbridge | - | - | - | - | |
| Feb 11 | at Alberta | L, 108-68 | - | 0 | 0 | 2.0 |
| Feb 12 | at Alberta | L, 92-56 | 1 | 2 | 0 | 1.0 |
| Feb 18 | Mount Royal University | L, 102-62 | 1 | 3 | 0 | 3.0 |
| Feb 19 | Mount Royal University | L, 89-69 | 1 | 1 | 0 | 3.0 |
| Feb 24 | Lethbridge | L, 84-70 | 1 | 2 | 0 | - |
| Feb 25 | Lethbridge | L, 95-73 | 1 | 1 | 0 | 0.7 |
| Statistic | gp | gs | min | fg | pct | 3pt | pct | ft | pct | pts |
|---|---|---|---|---|---|---|---|---|---|---|
| 2018-19 | 17 | - | 153 | 11-33 | 33.3 | 6-23 | 26.1 | 2-3 | 66.7 | 30 |
| 2019-20 | 20 | 1 | 375 | 30-84 | 35.7 | 16-45 | 35.6 | 28-36 | 77.8 | 104 |
| 2020-21 | - | - | - | 0-0 | - | 0-0 | - | 0-0 | - | 0 |
| 2021-22 | 16 | 11 | 410 | 31-103 | 30.1 | 17-57 | 29.8 | 28-39 | 71.8 | 107 |
| Total | 53 | 12 | 938 | 72-220 | 32.7 | 39-125 | 31.2 | 58-78 | 74.4 | 241 |
| Statistic | gp | min | min/g | fg/40 | 3pt/40 | pct | ft/40 | pts/40 |
|---|---|---|---|---|---|---|---|---|
| 2018-19 | 17 | 153 | 9.0 | 0.0-0.0 | 0.0-0.0 | 26.1 | 0.0-0.0 | 0.0 |
| 2019-20 | 20 | 375 | 18.8 | 0.0-0.0 | 0.0-0.0 | 35.6 | 0.0-0.0 | 0.0 |
| 2020-21 | - | - | - | 0.0-0.0 | 0.0-0.0 | - | 0.0-0.0 | - |
| 2021-22 | 16 | 410 | 25.6 | 0.0-0.0 | 0.0-0.0 | 29.8 | 0.0-0.0 | 0.0 |
| Total | 53 | 938 | 17.7 | 0.0-0.0 | 0.0-0.0 | 31.2 | 0.0-0.0 | 0.0 |
| Statistic | gp | min/g | fg/g | 3pt/g | ft/g | ppg |
|---|---|---|---|---|---|---|
| Event | ||||||
| Total | 16 | 25.6 | 1.9-6.4 | 1.1-3.6 | 1.8-2.4 | 6.7 |
| Conference | 16 | 25.6 | 1.9-6.4 | 1.1-3.6 | 1.8-2.4 | 6.7 |
| Exhibition | 5 | 33.8 | 3.6-10.0 | 1.2-5.2 | 3.2-4.4 | 11.6 |
| Location | ||||||
| Home | 8 | 25.6 | 2.4-6.8 | 1.4-3.6 | 1.2-2.0 | 7.4 |
| Away | 8 | 25.6 | 1.5-6.1 | 0.8-3.5 | 2.2-2.9 | 6.0 |
| Neutral | - | - | 0.0-0.0 | 0.0-0.0 | 0.0-0.0 | - |
| Result | ||||||
| Wins | - | - | 0.0-0.0 | 0.0-0.0 | 0.0-0.0 | - |
| Losses | 16 | 25.6 | 1.9-6.4 | 1.1-3.6 | 1.8-2.4 | 6.7 |
| Month | ||||||
| October | 2 | 23.0 | 2.0-7.0 | 1.0-5.0 | 0.5-1.0 | 5.5 |
| November | 2 | 28.0 | 1.5-7.5 | 1.5-4.5 | 2.0-2.5 | 6.5 |
| December | 2 | 30.0 | 1.0-8.0 | 0.5-3.5 | 2.5-2.5 | 5.0 |
| January | 4 | 17.8 | 0.8-3.8 | 0.2-2.2 | 1.5-1.8 | 3.3 |
| February | 6 | 29.5 | 3.2-7.2 | 1.7-3.7 | 2.0-3.3 | 10.0 |
| Statistic | gp | gs | min | fg | pct | 3pt | pct | ft | pct | pts |
|---|---|---|---|---|---|---|---|---|---|---|
| Event | ||||||||||
| Total | 16 | 11 | 410 | 31-103 | 30.1 | 17-57 | 29.8 | 28-39 | 71.8 | 107 |
| Conference | 16 | 11 | 410 | 31-103 | 30.1 | 17-57 | 29.8 | 28-39 | 71.8 | 107 |
| Exhibition | 5 | 5 | 169 | 18-50 | 36.0 | 6-26 | 23.1 | 16-22 | 72.7 | 58 |
| Location | ||||||||||
| Home | 8 | 6 | 205 | 19-54 | 35.2 | 11-29 | 37.9 | 10-16 | 62.5 | 59 |
| Away | 8 | 5 | 205 | 12-49 | 24.5 | 6-28 | 21.4 | 18-23 | 78.3 | 48 |
| Neutral | - | - | - | 0-0 | - | 0-0 | - | 0-0 | - | 0 |
| Result | ||||||||||
| Wins | - | - | - | 0-0 | - | 0-0 | - | 0-0 | - | 0 |
| Losses | 16 | 11 | 410 | 31-103 | 30.1 | 17-57 | 29.8 | 28-39 | 71.8 | 107 |
| Month | ||||||||||
| October | 2 | 2 | 46 | 4-14 | 28.6 | 2-10 | 20.0 | 1-2 | 50.0 | 11 |
| November | 2 | 2 | 56 | 3-15 | 20.0 | 3-9 | 33.3 | 4-5 | 80.0 | 13 |
| December | 2 | 2 | 60 | 2-16 | 12.5 | 1-7 | 14.3 | 5-5 | 100.0 | 10 |
| January | 4 | 0 | 71 | 3-15 | 20.0 | 1-9 | 11.1 | 6-7 | 85.7 | 13 |
| February | 6 | 5 | 177 | 19-43 | 44.2 | 10-22 | 45.5 | 12-20 | 60.0 | 60 |
| Statistic | gp | min | min/g | fg/40 | 3pt/40 | pct | ft/40 | pts/40 |
|---|---|---|---|---|---|---|---|---|
| Event | ||||||||
| Total | 16 | 410 | 25.6 | 0.0-0.0 | 0.0-0.0 | 29.8 | 0.0-0.0 | 0.0 |
| Conference | 16 | 410 | 25.6 | 0.0-0.0 | 0.0-0.0 | 29.8 | 0.0-0.0 | 0.0 |
| Exhibition | 5 | 169 | 33.8 | 0.0-0.0 | 0.0-0.0 | 23.1 | 0.0-0.0 | 0.0 |
| Location | ||||||||
| Home | 8 | 205 | 25.6 | 0.0-0.0 | 0.0-0.0 | 37.9 | 0.0-0.0 | 0.0 |
| Away | 8 | 205 | 25.6 | 0.0-0.0 | 0.0-0.0 | 21.4 | 0.0-0.0 | 0.0 |
| Neutral | - | - | - | 0.0-0.0 | 0.0-0.0 | - | 0.0-0.0 | - |
| Result | ||||||||
| Wins | - | - | - | 0.0-0.0 | 0.0-0.0 | - | 0.0-0.0 | - |
| Losses | 16 | 410 | 25.6 | 0.0-0.0 | 0.0-0.0 | 29.8 | 0.0-0.0 | 0.0 |
| Month | ||||||||
| October | 2 | 46 | 23.0 | 0.0-0.0 | 0.0-0.0 | 20.0 | 0.0-0.0 | 0.0 |
| November | 2 | 56 | 28.0 | 0.0-0.0 | 0.0-0.0 | 33.3 | 0.0-0.0 | 0.0 |
| December | 2 | 60 | 30.0 | 0.0-0.0 | 0.0-0.0 | 14.3 | 0.0-0.0 | 0.0 |
| January | 4 | 71 | 17.8 | 0.0-0.0 | 0.0-0.0 | 11.1 | 0.0-0.0 | 0.0 |
| February | 6 | 177 | 29.5 | 0.0-0.0 | 0.0-0.0 | 45.5 | 0.0-0.0 | 0.0 |
| Statistic | gp | off/g | def/g | reb/g | ast/g | to/g | stl/g | blk/g |
|---|---|---|---|---|---|---|---|---|
| Event | ||||||||
| Total | 16 | 0.4 | 2.3 | 2.8 | 1.9 | 1.6 | 0.6 | 0.0 |
| Conference | 16 | 0.4 | 2.3 | 2.8 | 1.9 | 1.6 | 0.6 | 0.0 |
| Exhibition | 5 | 0.4 | 4.0 | 4.4 | 3.0 | 1.8 | 0.6 | 0.2 |
| Location | ||||||||
| Home | 8 | 0.5 | 3.4 | 3.9 | 2.3 | 1.5 | 0.4 | 0.0 |
| Away | 8 | 0.4 | 1.3 | 1.6 | 1.6 | 1.6 | 0.8 | 0.0 |
| Neutral | - | - | - | - | - | - | - | - |
| Result | ||||||||
| Wins | - | - | - | - | - | - | - | - |
| Losses | 16 | 0.4 | 2.3 | 2.8 | 1.9 | 1.6 | 0.6 | 0.0 |
| Month | ||||||||
| October | 2 | 0.0 | 1.5 | 1.5 | 1.5 | 2.5 | 0.5 | 0.0 |
| November | 2 | 1.0 | 2.5 | 3.5 | 0.5 | 2.5 | 0.0 | 0.0 |
| December | 2 | 1.0 | 0.5 | 1.5 | 1.5 | 1.5 | 1.5 | 0.0 |
| January | 4 | 0.3 | 1.5 | 1.8 | 2.3 | 0.8 | 0.5 | 0.0 |
| February | 6 | 0.3 | 3.7 | 4.0 | 2.5 | 1.5 | 0.5 | 0.0 |
| Statistic | gp | gs | off | def | reb | ast | to | stl | blk |
|---|---|---|---|---|---|---|---|---|---|
| Event | |||||||||
| Total | 16 | 11 | 7 | 37 | 44 | 31 | 25 | 9 | 0 |
| Conference | 16 | 11 | 7 | 37 | 44 | 31 | 25 | 9 | 0 |
| Exhibition | 5 | 5 | 2 | 20 | 22 | 15 | 9 | 3 | 1 |
| Location | |||||||||
| Home | 8 | 6 | 4 | 27 | 31 | 18 | 12 | 3 | 0 |
| Away | 8 | 5 | 3 | 10 | 13 | 13 | 13 | 6 | 0 |
| Neutral | - | - | - | - | - | - | - | - | - |
| Result | |||||||||
| Wins | - | - | - | - | - | - | - | - | - |
| Losses | 16 | 11 | 7 | 37 | 44 | 31 | 25 | 9 | 0 |
| Month | |||||||||
| October | 2 | 2 | 0 | 3 | 3 | 3 | 5 | 1 | 0 |
| November | 2 | 2 | 2 | 5 | 7 | 1 | 5 | 0 | 0 |
| December | 2 | 2 | 2 | 1 | 3 | 3 | 3 | 3 | 0 |
| January | 4 | 0 | 1 | 6 | 7 | 9 | 3 | 2 | 0 |
| February | 6 | 5 | 2 | 22 | 24 | 15 | 9 | 3 | 0 |
| Statistic | gp | off/40 | def/40 | reb/40 | ast/40 | to/40 | stl/40 | blk/40 |
|---|---|---|---|---|---|---|---|---|
| Event | ||||||||
| Total | 16 | 0.0 | 0.0 | 0.0 | 0.0 | 0.0 | 0.0 | 0.0 |
| Conference | 16 | 0.0 | 0.0 | 0.0 | 0.0 | 0.0 | 0.0 | 0.0 |
| Exhibition | 5 | 0.0 | 0.0 | 0.0 | 0.0 | 0.0 | 0.0 | 0.0 |
| Location | ||||||||
| Home | 8 | 0.0 | 0.0 | 0.0 | 0.0 | 0.0 | 0.0 | 0.0 |
| Away | 8 | 0.0 | 0.0 | 0.0 | 0.0 | 0.0 | 0.0 | 0.0 |
| Neutral | - | - | - | - | - | - | - | - |
| Result | ||||||||
| Wins | - | - | - | - | - | - | - | - |
| Losses | 16 | 0.0 | 0.0 | 0.0 | 0.0 | 0.0 | 0.0 | 0.0 |
| Month | ||||||||
| October | 2 | 0.0 | 0.0 | 0.0 | 0.0 | 0.0 | 0.0 | 0.0 |
| November | 2 | 0.0 | 0.0 | 0.0 | 0.0 | 0.0 | 0.0 | 0.0 |
| December | 2 | 0.0 | 0.0 | 0.0 | 0.0 | 0.0 | 0.0 | 0.0 |
| January | 4 | 0.0 | 0.0 | 0.0 | 0.0 | 0.0 | 0.0 | 0.0 |
| February | 6 | 0.0 | 0.0 | 0.0 | 0.0 | 0.0 | 0.0 | 0.0 |


